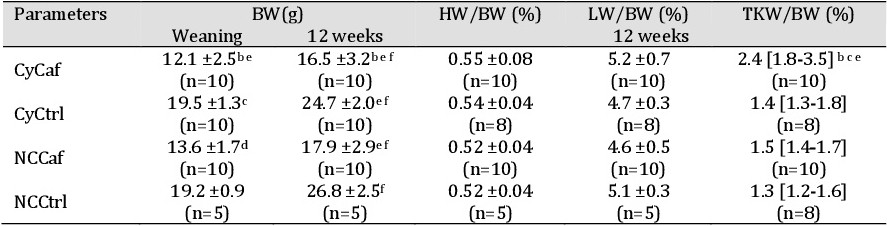
Table 1. Comparison of body weight (BW), heart weight (HW), liver weight (LW) and total kidney weight (TKW)Comparison intergroups: a p< 0.05 and bp<0.001 versus CyCtrl; c p<0.001 versus NCCaf; d p<0.05 and e p<0.001 versus NCCtrl, and intragroups: fp< 0.001. Cystic animals: caffeine (CyCaf), control (CyCtrl); noncystic animals: caffeine (NCCaf) and control (NCCtrl)